Table of Contents:
- What is a stock chart-really?
- What are chart patterns?
- Four basic chart patterns for beginners
- Fear and Greed
The best way for the beginner to learn to read stock charts is through experiential learning or “learn by doing”. Jump right in and start experiencing stock charts in action. Click every button and see what you find. Keep a running list of questions and then do your research to find your answers. Keep repeating this process over and over again and you will quickly develop a proficiency in reading the charts.
Stock charts are one the most recognized tools used by traders worldwide. The explosion of the internet has led to an equal explosion in the use of stock charts. Prior to the internet, the only way to get stock charts was in a printed version which were mailed to you in book form. It was cumbersome and only the most dedicated practitioners even tried. When the internet took off in the 1990’s the use of stock charts did so in kind.
What is a stock chart-really?
A stock chart is simply a visual representation of a stocks price movement. Charts allow you to look at the price movement over various time frames. (1 day; 5 day; 1 month; 3 months; 6 months etc.) Analyzing a stock from many different time frames is very important as it gives you the big picture of the stock’s performance and may give clues as to where the price may go in the future.
Stock charting software usually also contains many tools that can assist you in analyzing the stocks price movement. Tools like drawing tools, Indicators and oscillators all allow you to compare and analyze a stock’s movement against other various different measurements.
The key thing to remember is that all of the tools that are available are only there to help you better analyze the stock’s price movement.
What are chart patterns?
Chart patterns are recurring patterns in the price movement of a stock that are identifiable on the stock chart. Many of these patterns have been tested with time and if they do what their supposed to do, can help you trade more profitably. A very important thing to note is that a chart always represents what has happened in the past. Chart patterns do not predict the future.
The effectiveness of chart patterns will change with general market conditions. Many bullish chart patterns will fail as we enter a market correction or bear market. The new trader needs to continuously monitor and be aware of current market conditions when using charts to trade.
There are literally hundreds of different chart patterns. I always suggest new traders familiarize themselves with a few of the key patterns which have shown to be consistent in the results they deliver.
Four Basic chart patterns for beginners
As you know from previous posts, for beginners, we recommend swing trading. We teach our new traders to focus on a few basic chart patterns as the apply to swing trading. By learning this way, you will become proficient much quicker and then you can explore other patterns and see if they make sense to you.
Channels
A channel is a stock pattern where the price of the stock fluctuates between two parallel trend lines that you draw on the stock chart. Once a stock forms a channel, the price tends to stay within the confines of the channel until it “breaks out” (either higher or lower) and starts to form a new channel in a different direction. There are three types of channels
- Bull or upward channel
- Sideways Channel
- Downward of bear channel.
Here is what a stock channel (Bull) looks like
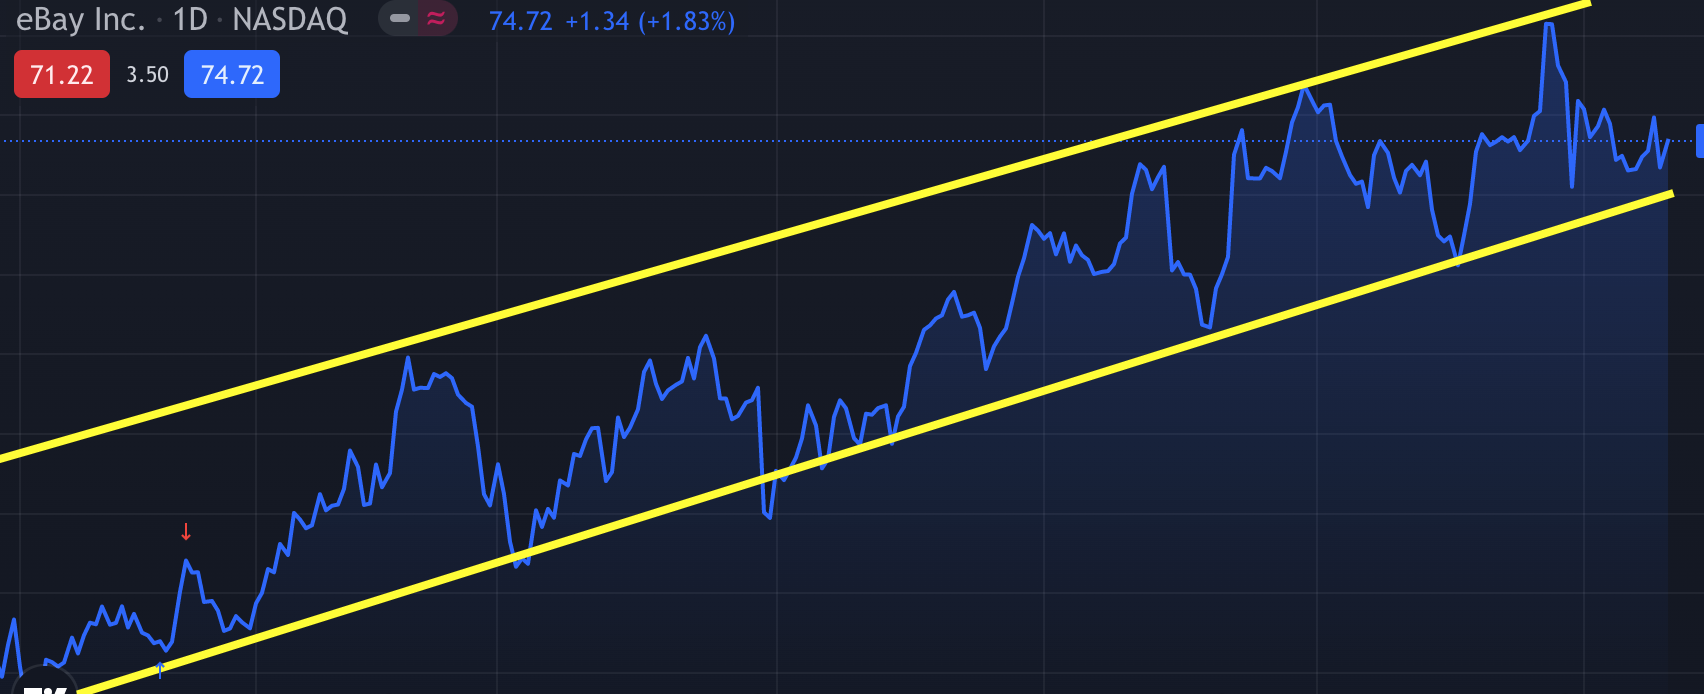
Channels are the basic pattern that is most useful to the swing trader. The goal is to Buy the stock as it touches the bottom trend line of the channel and sell it as it reaches the top trend line of the current channel.
Some traders like to wait until a stock breaks out of a channel and then they enter the position hoping a new trend has begun. Channels appear frequently and in all time frames so you should strive to be proficient in drawing and using them. They should form the basis of much of your early swing trading efforts.
The wedge
A wedge pattern occurs when the stock’s price consistently stops at the same price level on the downside and on the upside consistently stops a lower and lower levels. This type of price action forms a wedge.
Here is what a typical wedge pattern may look like:
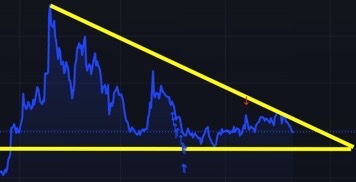
Once the stock is completely wedged, the stock will typically break higher or lower and the wedge pattern is done.
Wedge patterns have been very consistent patterns for us to swing trade. When they hit the end of the wedge they have often broken out and given us a nice gain on that strong upward movement. We pay particular attention to wedges that are forming while we are already in a position. If the wedge is forming and acting well, we may often increase our position highly recommend our students use them to find consistent winning trades.
Cup with handle
The name of this chart pattern describes the chart pattern perfectly. Many chartists have a list of rules that this chart pattern should abide by. In our experience, using them is very simple. The more that the pattern looks like a real cup with a handle, the more successful the pattern is. The chart below shows a cup with handle chart pattern.
Here is what a cup with handle pattern might look like:
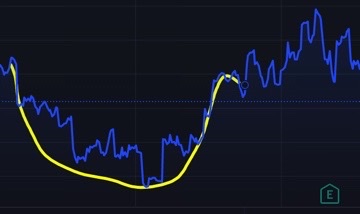
The cup with handle is a bullish stock pattern which means that at the end of the pattern the stock should go up or increase in price. Traders like to buy the stock long as it the price breaks out of the handle. As swing traders, we try to recognize when a stock we are in is starting to form a cup with handle. Buy at the bottom of the cup and sell at the top rim of the cup. True cup with handles formations are harder to find, but they are very effective when you do find them.
Head and shoulders
We included this chart pattern because current market conditions suggest that we could be approaching a change in the basic market trend. As the market environment has become more and more uncertain, the more we have seen this chart pattern start to appear. I believe that this pattern will start to appear in stocks (and market indexes) at the top of a long bull market or at the bottom of a real market correction or bear market. This pattern usually does not appear in the middle of a strong bull or bear run. The image below is an example of a head and shoulders pattern.
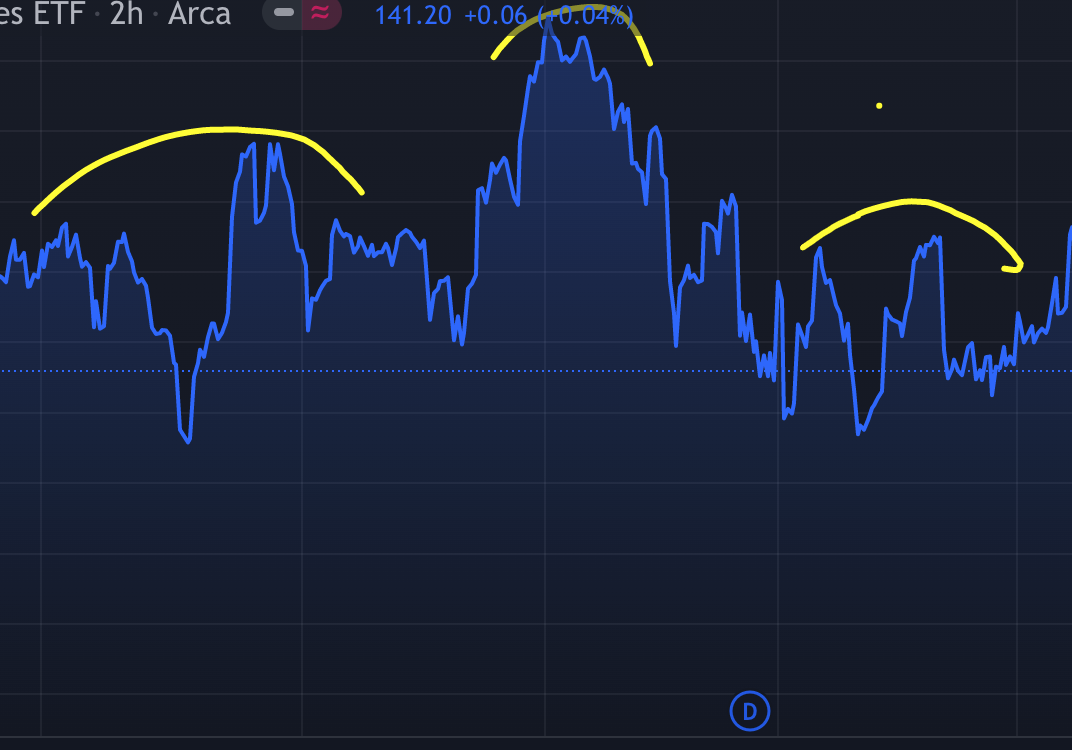
You are more likely to run into a head and shoulders top then a head and shoulders bottom. They are rare and much harder to recognize. Once the right shoulder of the pattern forms more times than not the stock drops off the end dramatically with a quick drop in price. If you are in a stock and it is forming a head and shoulders pattern, you must be very careful and even consider exiting the position. You should never enter a long position in a stock that is displaying a well-formed head and shoulders top.
Fear and Greed
There is a famous quote from the best investor of all time, Warren Buffet, that goes: “be fearful when others are greedy and greedy when others are fearful”. This is the basic mindset you must adopt if you are going to make money in the market. The reason I bring this up to you is that a stocks chart literally shows you where the fear and greed are in your stock. Swing trading, when done the right way, uses this mindset. You should always keep this quote in mind when you look at a stock chart. Here is what I see when I look at a price chart:
Image fear and greed
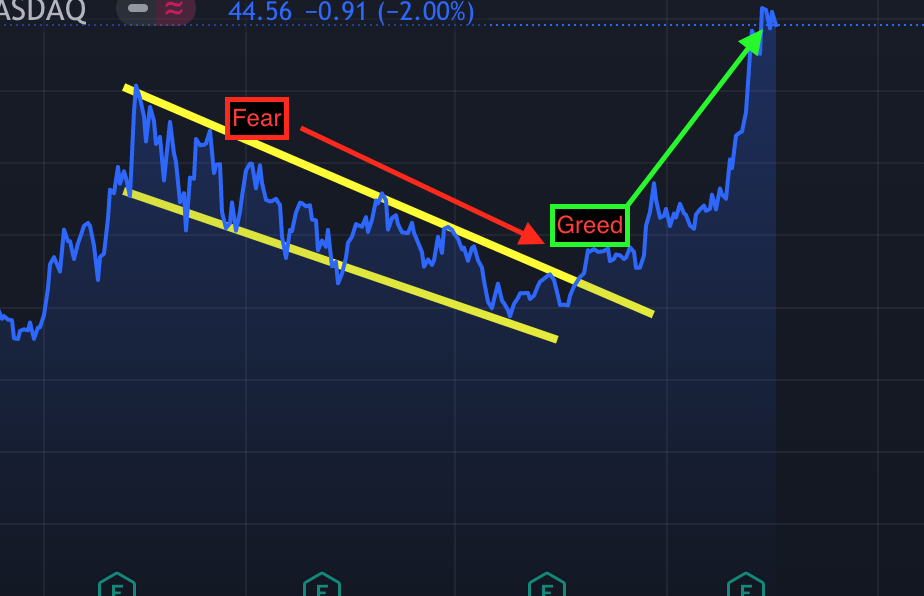
In essence Warren Buffet’s quote is literally shown visually in this stock chart. If you always keep this in mind, stock charts will make a lot more sense to you.
Key Takeaways
- The best way to learn to read stock charts is to use experiential learning
- A stock chart is simply visual representation of the stock’s price over a certain period of time
- New traders should focus on learning and using a few key stock patterns
- The mindset you must adopt comes from Warren Buffet when he said: “be fearful when others are greedy and greedy when others are fearful”
Conclusion
When people first explore trading, they are instantaneously introduced to stock charts. They can be a bit intimidating in the beginning. There is a lot of information on them and they are identified using trading jargon a new trader may not be familiar with. While using stock charts is not all there is to trading, it is very important to learn to read and use them.
This post is a primer in how to read stock charts. We discussed the fact that charts are a visual representation of a stock price movement over time. We discussed what chart patterns are and how to use them. We discussed 4 basic chart patterns that beginners should know, and we discussed how to look at a chart from the standpoint of fear and greed. The next step is up to you. Get yourself a good charting service (Tradingview.com is a good one!) and jump in! Happy learning!
Note: all images are provided by Tradingview.com via screen capture