To fully understand a stock quote, you must first make sure that you understand each component of the quote and what it means. A beginner trader must familiarize themselves with the new vocabulary or nomenclature of a stock quote to fully understand it.
Table of Contents
- Introduction
- Stock Symbol
- Name of Company
- Industry Segment
- Last Trade
- The bid Price
- The offer Price
- The size of the market
- The spread
- Volume
- Conclusion
Introduction
A stock quote seems like a very simple thing. You go almost any financial site on the internet and pull up the stock’s symbol and you get a quote. Easy as pie, or is it? When you look closely at the stock quote, you will notice that there is a lot more data built into it than you probably thought. We are going to explore all of the data points that come along with an ordinary stock quote. We will look at why that data is there and why you need to understand it to help you in your trading endeavors.
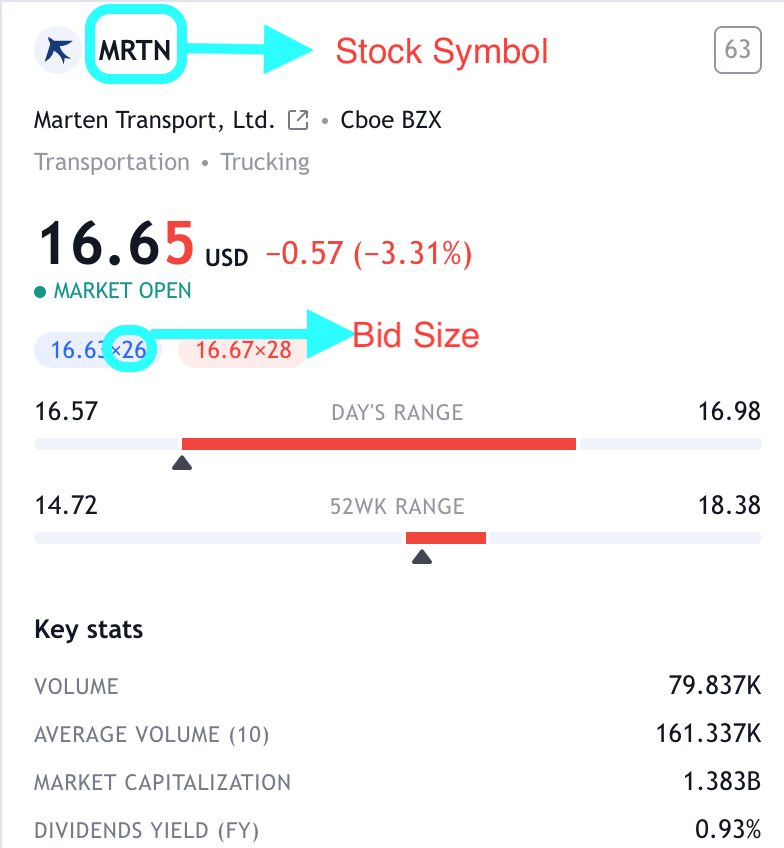
Stock Symbol
The very first piece of information you are given is the stock’s symbol. There are literally tens of thousands of stocks traded on various exchanges around the world. Many of these securities have similar names which can lead to confusion as to which company’s stock you actually wanted to look up. The symbol helps us ensure that we are looking at the exact right asset that we intended to. Using the symbol helps you to avoid mistakes like buying the wrong stock.
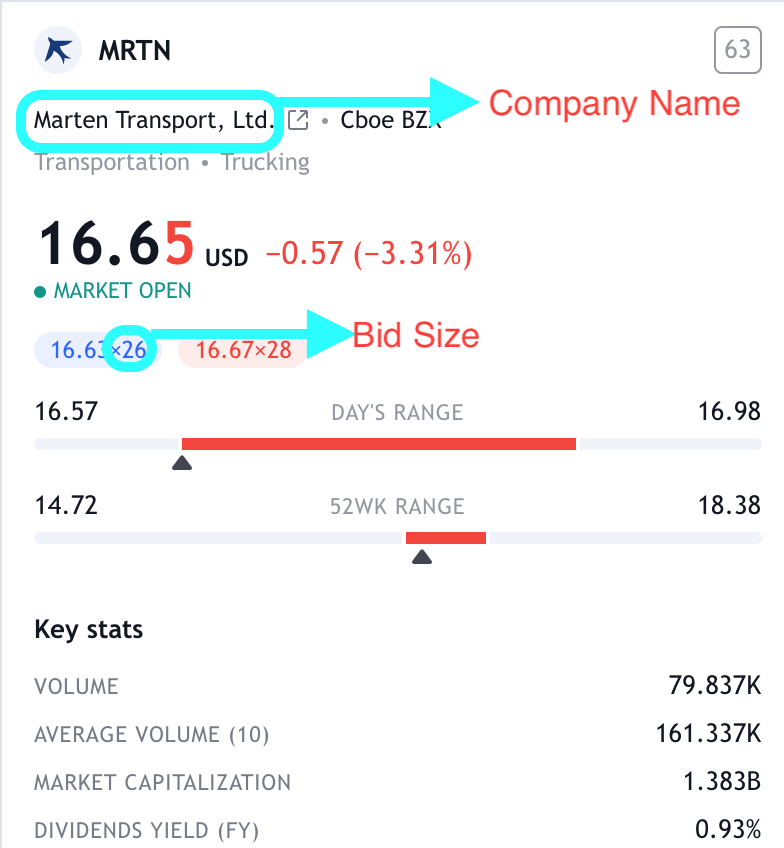
Name of Company
The very next thing you are going to see on the stock quote is the legal name of the company. It allows you to cross reference it with the stock symbol to make sure you are looking at the correct stock. If there seems like something is not right when you are looking at the company name and the stock symbol, check it out, don’t assume anything. Mistakes do happen and many times the problem started with not taking the extra time to look at the name and the symbol and make sure you are looking at the right asset.
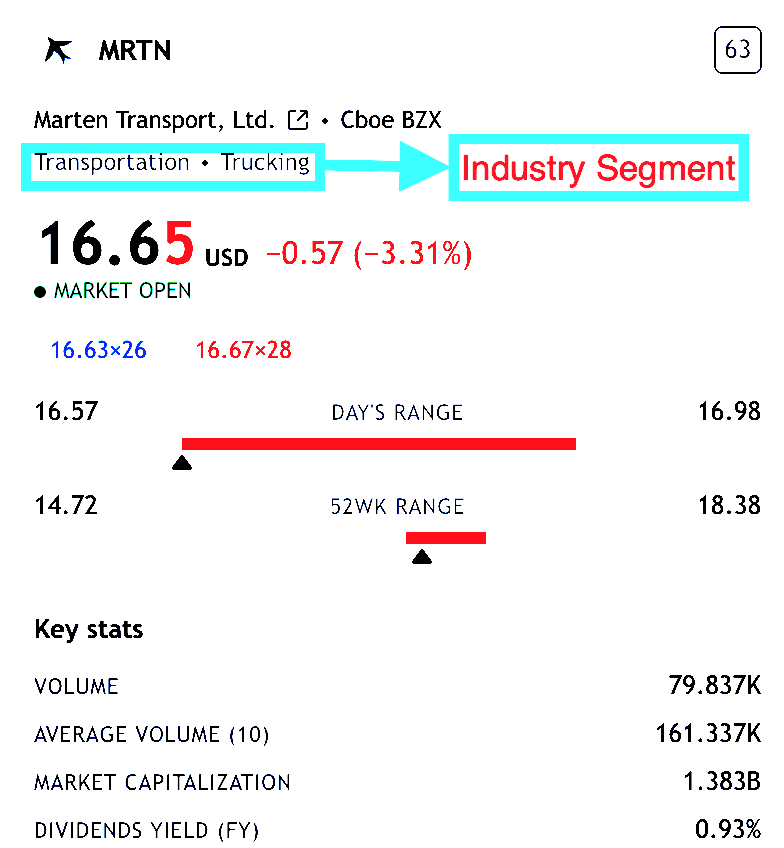
Industry Segment
The industry segment that a stock is part of can be very important information to you when you are trading. For example, if your stock is in the transportation and trucking industry and there is some major news about the industry you want to be aware of it right away. I have seen many young traders enter positions in which they had no idea of what industry the stock was in and what the company actually does.
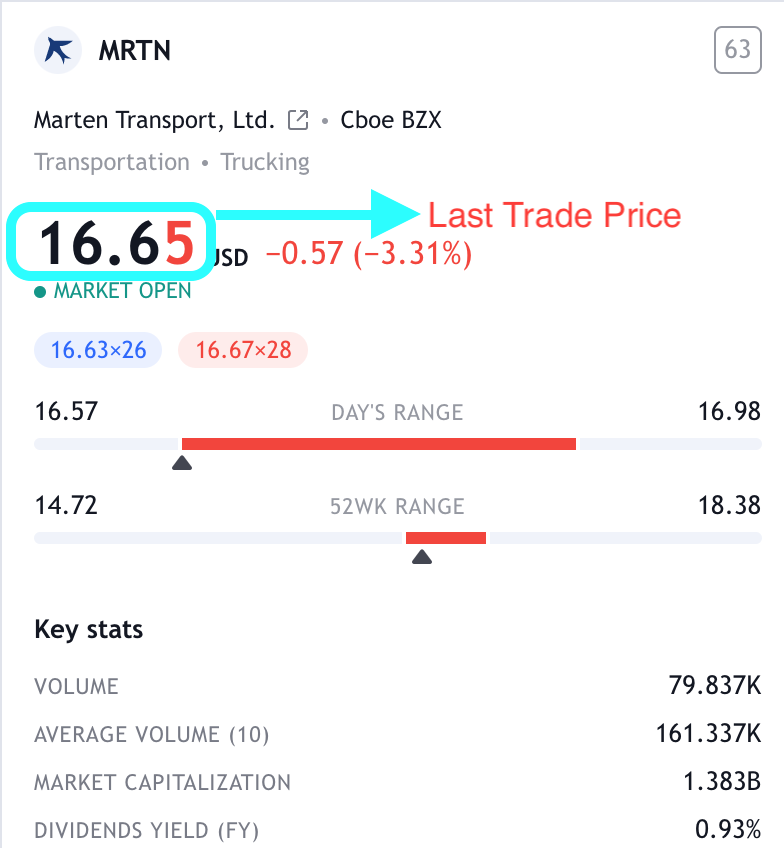
Last Trade
The last trade shown on the quote is the very last trade that has occurred in this stock. It could have been executed on the bid, or the offer or anywhere in between. Obviously, this number changes continuously especially if you are trading a stock that has a lot of volume. When people are asked what the current price of the stock is, this is the number they are referring to.
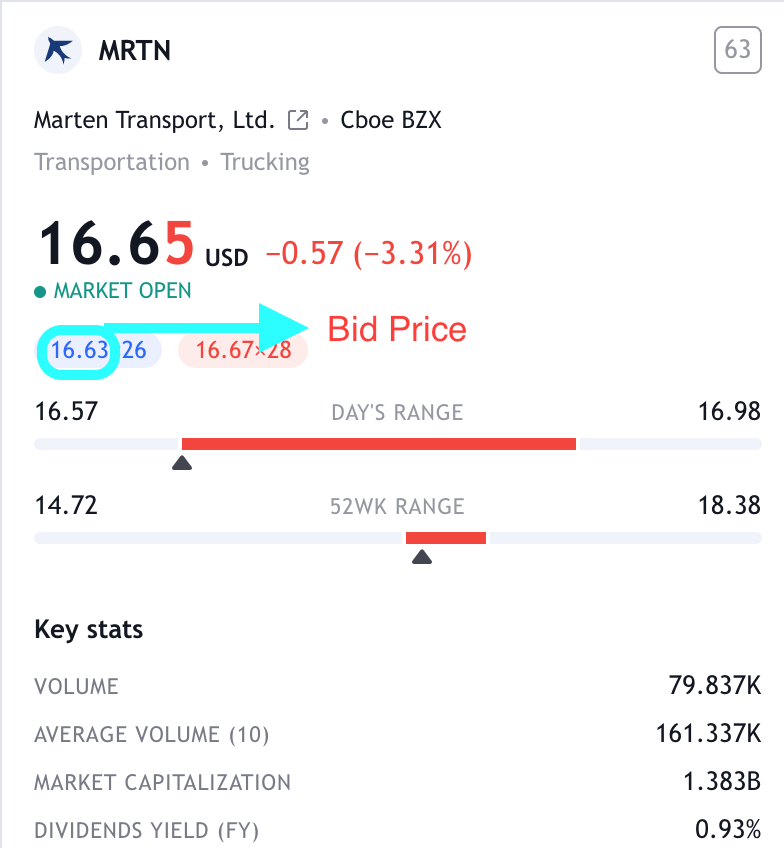
The Bid Price
A stock’s bid price represents the highest price any buyer is willing to pay to purchase the stock at that moment in time. It is always the lower of the two numbers that make up a stock quote. The bid is usually the price that most retail investors sell their stock at. If you put in a “market” order to sell a stock, the bid price is the price you are going to get.
Most professional traders do the opposite of a retail investor and buy their stock at the bid price. If they are in a good trading groove, they are never going to “pay up” and take the offer. They wait and use limit orders to get executed for their buy on the bid. This takes skill and patience but can really play an instrumental role in you hitting your trade goal for this stock.
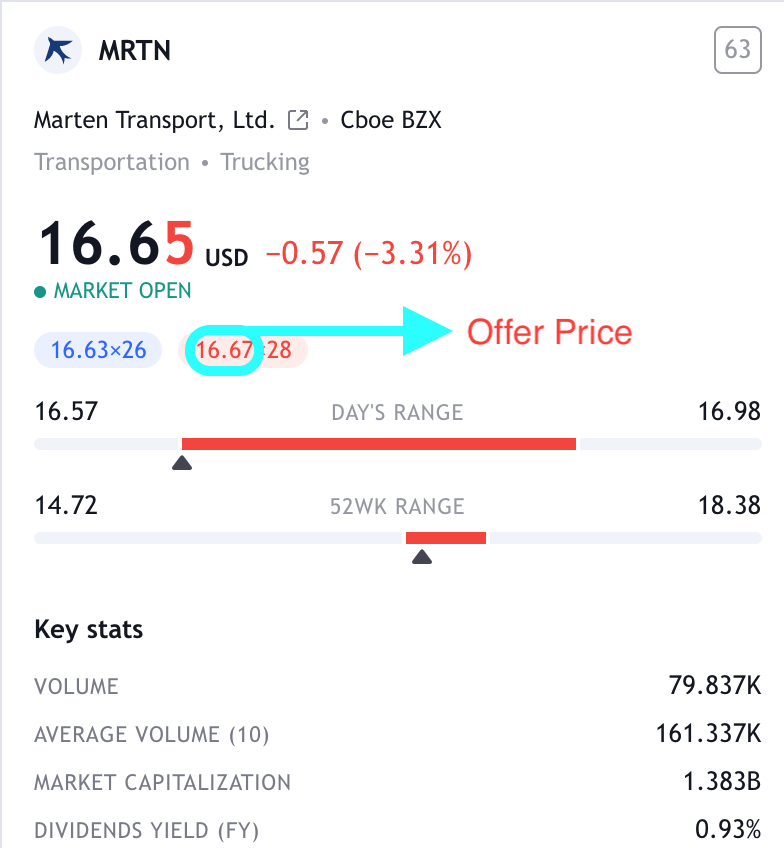
The Offer Price
The offer price of a stock is the lowest price someone is willing to sell their stock at the current moment. The offer is sometimes referred to as the “ask” and is always the higher of the two numbers listed on the stock quote. The offer is usually the price retail investors pay to buy a stock. It is the price you will get when you put in a “market” order.
Professional traders always have an exit plan and already have their sell orders (limit order) put in at their target price. This allows them to sell into the strength of a strong upward move of the stock. Once again this takes skill and patience to accomplish on a consistent basis.
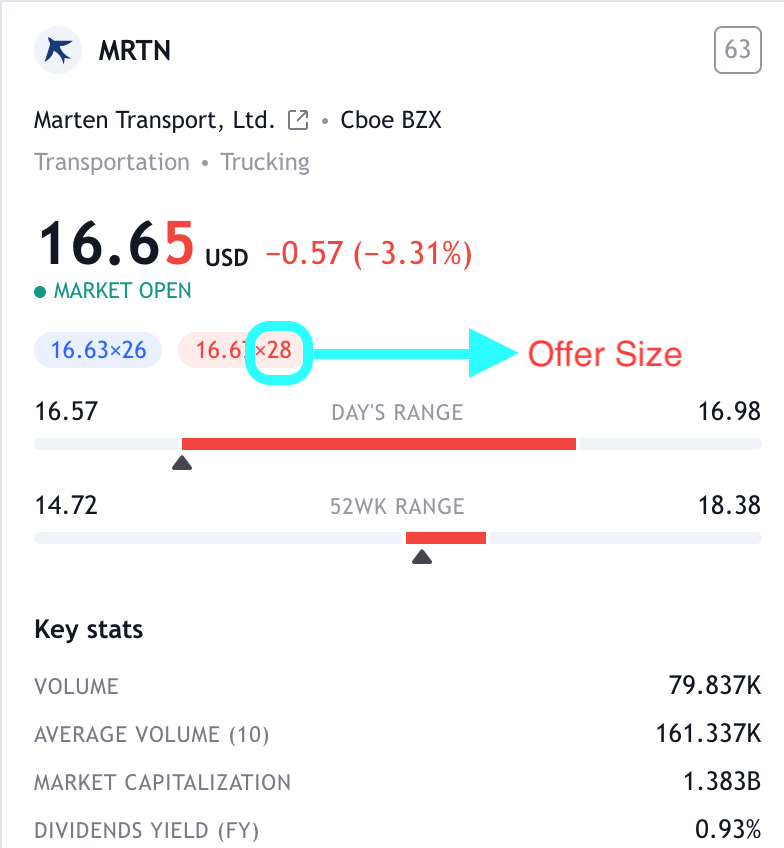
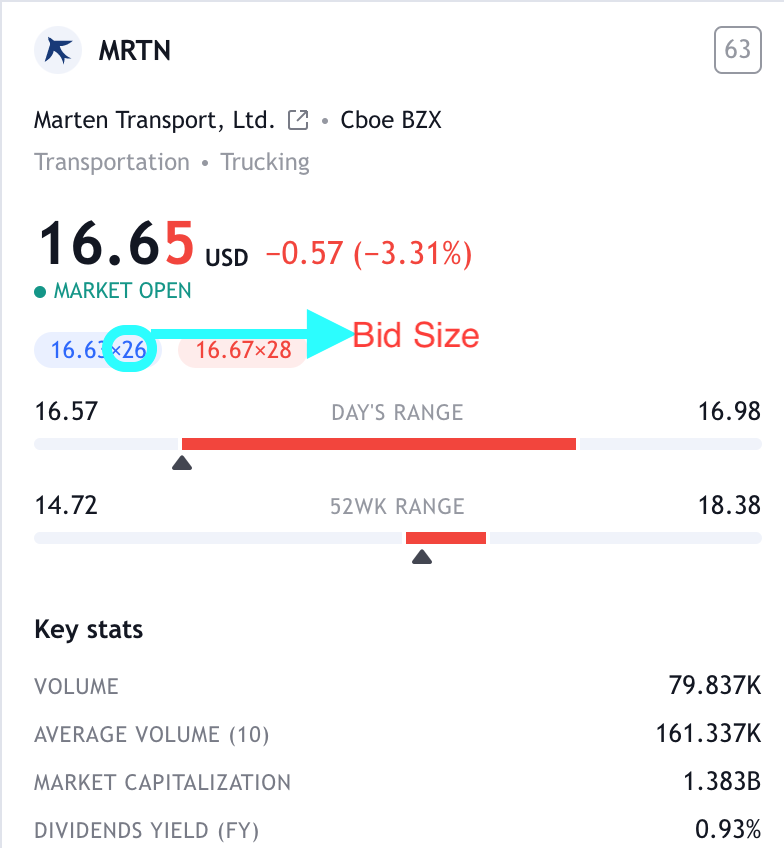
The “size” of the market
With each bid and offer price you will also see a number next to the price with an x (49.52 x 50). The x 50 means that there are 50 shares for sale at that price. This is important when you are trying to execute a trade. For the most part, trades are executed on a first come, first serve basis. The number of shares that will get executed is not unlimited. This is reflected in the size shown on the quote. This is also the reason why you should execute most of your trades using limit orders. Once you put in a limit order it is a live trade but does not get executed until the price hits your price target. It does reserve your space in line thus making it more likely that you will get the price you set in your limit order.
The spread
The differential between the bid price and the offer price is called the spread. The spread for large more establish stocks is usually very small. The spread for a Dow industrial stock is usually around .01 unless there is something crazy going on that day.
The spread for more thinly traded growth stocks is usually much higher. Spreads of .25 to .50 are not that uncommon. The general rule is that the smaller and riskier the stock, the larger the spread. Stocks that are traded on the Nasdaq small cap market or the pink sheets usually have very large spreads.
What does this mean for the trader? If you are going to trade highly speculative stocks, the spread will be wide. If a stock has a spread of .50 you are technically down in the stock by .50 the moment you buy it. If you entered the position by buying the offer and then sell at the bid, a big portion of your potential gains may be wiped out by the spread. You must learn how to trade correctly like a professional and learn to buy on the bid and sell on the offer using limit orders.
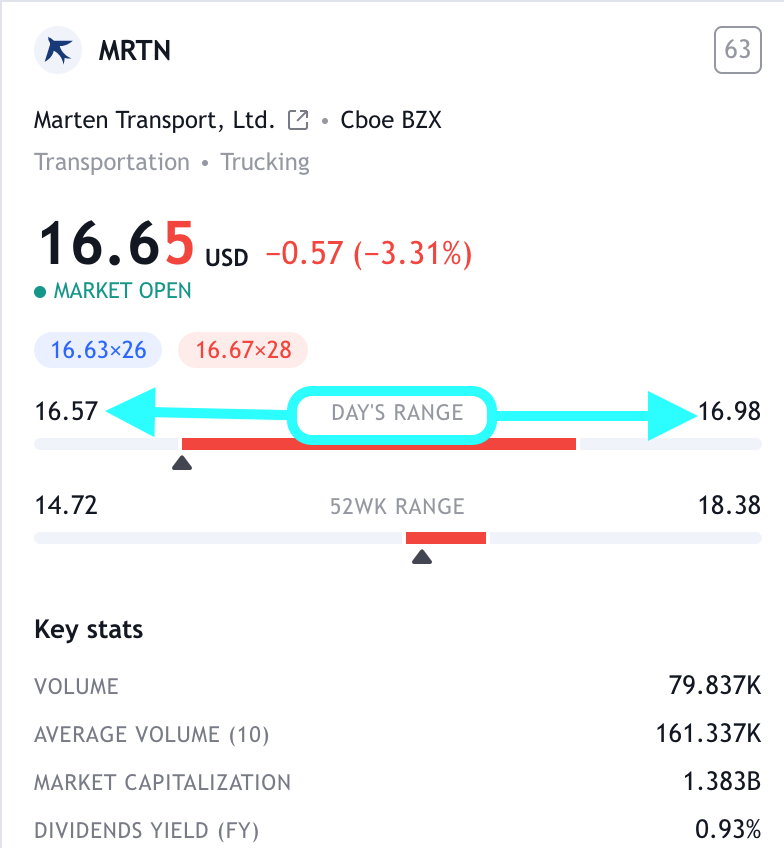
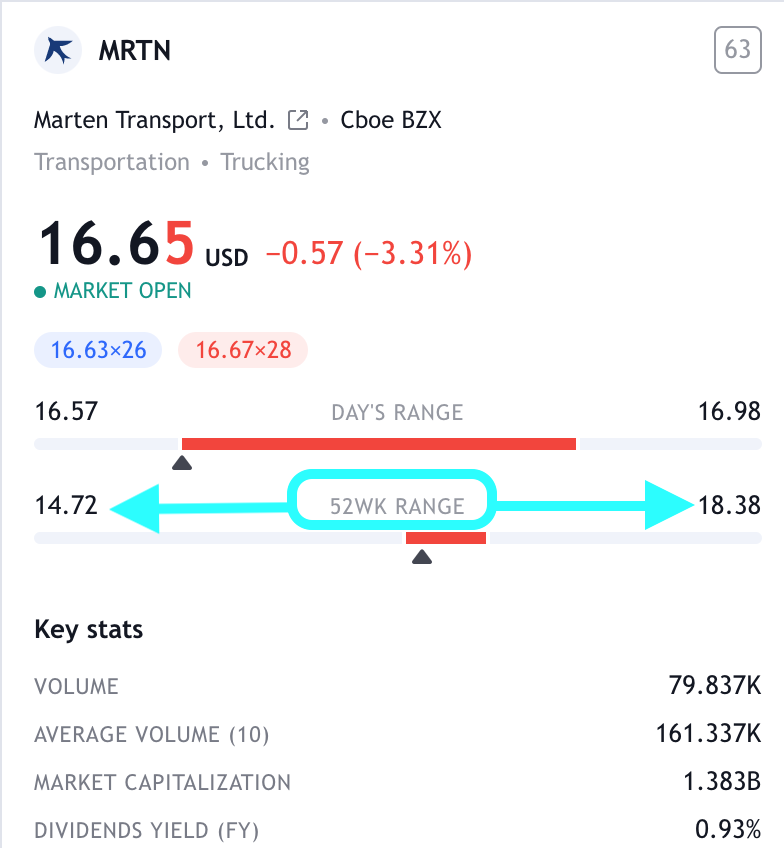
Range
The price quote will also contain two price ranges for your consideration. The first is the current day’s range. The second is the 52-week price range. Traders are able to know if they are buying at the top, middle or bottom of the price range. Day traders will rely heavily on the day’s price range. Momentum traders will rely on the 52-week high-low. Swing traders will use a combination of each of these two ranges to evaluate their trades.
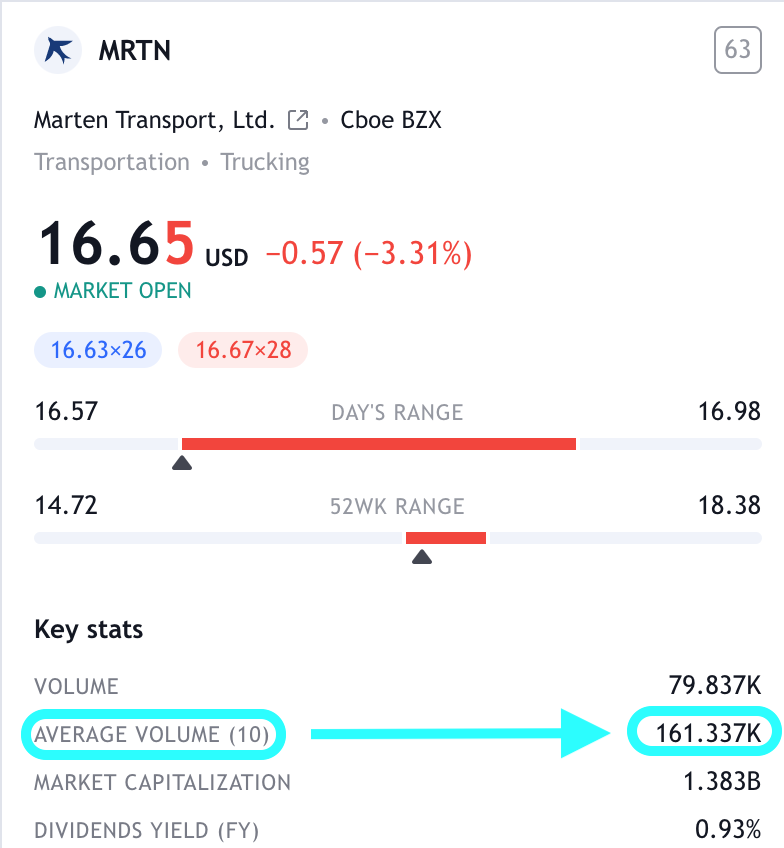
Volume
While not actually part of the stock’s price quote, the volume information usually comes right along with the stock prices. Stock quotes usually show both the total volume for the day and also show the stock’s average daily volume. This is important information for a trader. For example, a stock having a down day on several multiples of the average daily volume indicates a large number of sellers trying to get out. Also, a stock that is down a large amount but on half of its daily average volume may indicate that the down move is running out of sellers and a change in direction may be coming.
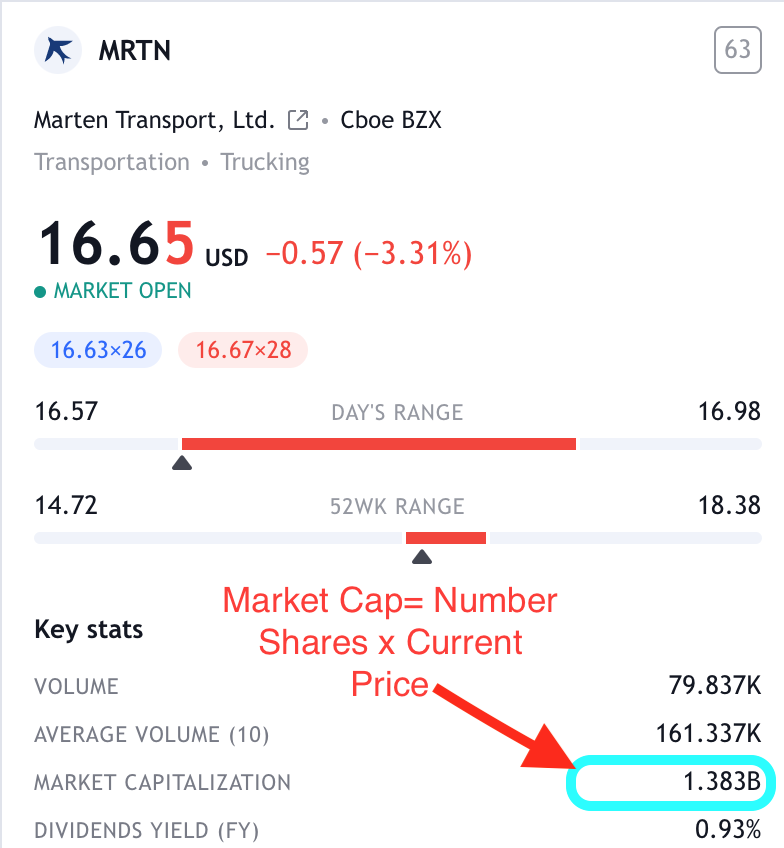
Market Capitalization
Market capitalization tells us just how big the stock is. Large cap stocks are those who have a market capitalization of $10B or more. Mid Cap stocks are stocks that have a market cap of $2B to $10B. The larger the market capitalization, the harder it is to move a stock up or down. For a large cap stock, the amount of buying or selling must be enormous due to the amount of shares outstanding.
Key Takeaways:
- A stock quote contains a lot more information than most people realize
- A stock’s symbol is a quick easy way to refer to a stock and to make sure you are looking at the right security
- The last trade price of a stock is what most people refer to as the price of the stock
- The spread of a stock is very important when trading. Many growth stocks can have very large spreads and you want to make sure you are not digging a hole for yourself by buying the stock at the offer price.
Conclusion
We have identified and discussed the different data points contained in most stock quotes. We discussed some of the ways in which this information is used by traders and investors and why.
All charts provided by Tradingview.com via screen shot